If you've ever managed source-to-target mapping in a spreadsheet, you know the pain. Tab after tab of column names. Manually typing source and target fields. Copying transformation rules into adjacent cells. Trying to trace a mapping visually across a 200-column spreadsheet. It works — barely. And it's where some of the most consequential mistakes in a data migration project happen.
How Spreadsheet Mapping Works (and Doesn't)
The typical spreadsheet mapping approach goes something like this. The migration analyst creates a workbook with a tab for each source-to-target table pair. Each row represents a column mapping. There are columns for the source field name, source data type, target field name, target data type, transformation rule, default value, exception handling, and maybe some notes.
On the surface, it's reasonable. But in practice, the problems stack up quickly:
- No visual context. You're looking at a flat grid of text. You can't see the relationship between source and target at a glance. You can't see which source columns are mapped and which are unmapped without scanning every row.
- Copy-paste errors. When you're manually typing or pasting column names from one document into a spreadsheet, typos happen. A source column name that's slightly wrong won't match anything — but you won't know until ETL development or testing, when the job fails or silently maps the wrong data.
- Incomplete mappings. It's easy to miss a column in a 200-column table when you're working row by row in a spreadsheet. There's no mechanism to flag unmapped columns or ensure completeness.
- Ambiguous transformation rules. Free-text cells describing transformation logic are interpreted differently by different developers. "Convert to uppercase" is clear. "Map to the appropriate target value based on business rules" is not. But both end up in the same free-text column, and the ETL developer has to figure it out.
- Version divergence. Multiple analysts working on mapping spreadsheets inevitably produce version conflicts. The mapping document the ETL developer builds from may not be the latest version, leading to implementation that doesn't match current requirements.
The Visual Mapping Approach
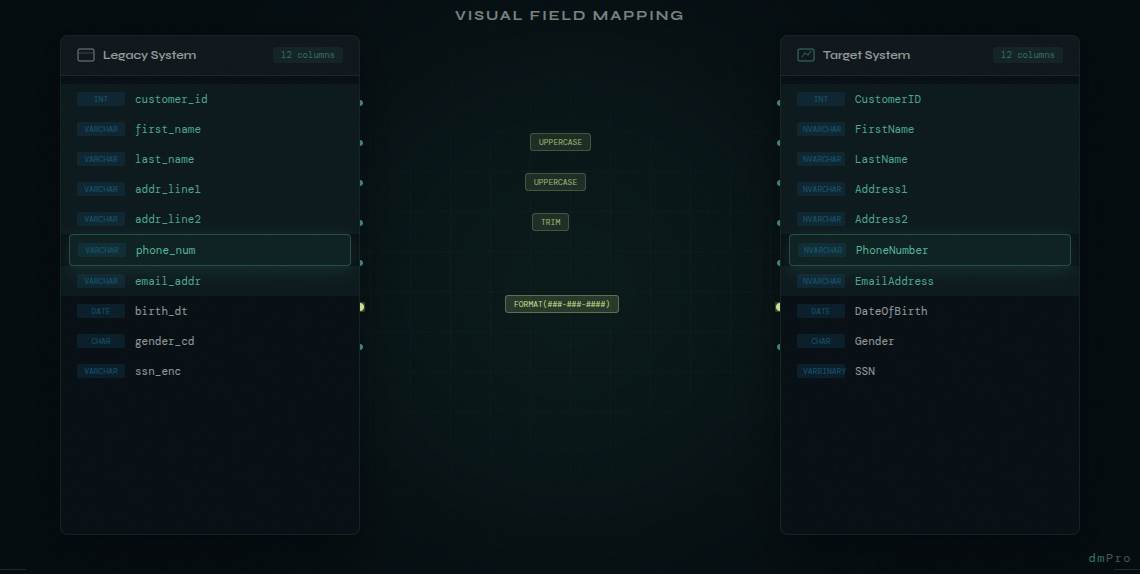
In dmPro, mapping is fundamentally different. Instead of a flat grid, you see your source columns on one side of the screen and your target columns on the other. You drag to connect them. The visual connection makes the relationship immediately clear — you can see at a glance what's mapped, what's not, and how data flows from source to target.
But visual clarity is just the starting point. Here's how the full mapping workflow works:
Step 1: Select Your Source and Target
Choose the source table and target table you're mapping. dmPro already knows about both because they're in your data catalog. The column lists are pulled directly from your catalog — no manual typing, no copy-paste errors.
Step 2: Create Mappings
Drag a source column to a target column to create a mapping. The connection is visually displayed as a line between the two sides. You can see immediately which columns are mapped and which still need attention. Unmapped columns on either side are clearly visible.
Step 3: Define Transformation Rules
For each mapping, define the transformation logic. dmPro lets you capture transformation rules, default values, and exception handling directly on the mapping itself. The difference from a spreadsheet isn't that the rules are less flexible — you can still write whatever transformation logic you need. The difference is that the rules are attached to the mapping they belong to, visible in context, and automatically included when the job spec is generated. No more hunting through spreadsheet tabs to find the transformation note for a particular column.
Step 4: Review and Validate
Before finalizing, review the complete mapping. dmPro highlights potential issues: unmapped required columns, data type mismatches, mappings that may need transformation logic. This validation step catches issues that would otherwise propagate into ETL development.
Auto-Generated Job Specifications
This is where the real efficiency gain happens. When a mapping is complete, dmPro auto-generates a detailed job specification — a complete, structured document that contains everything your ETL developer needs to build the migration job.
The generated spec includes:
- Source and target table details with full column metadata
- Every column mapping with data types on both sides
- Transformation rules captured directly on each mapping
- Default values and exception handling logic
- Business rules and special processing instructions
No more "what did the analyst mean by this?" conversations. No more hunting through spreadsheet tabs to piece together a complete picture. The spec is generated directly from the mapping data — every column, every transformation rule, every default value — so it's always complete and always reflects the current state of the mapping.
How Mapping Errors Compound Into Project Risk
Mapping errors might seem like small, correctable mistakes. But in a data migration project, they compound in ways that create significant risk:
- A missed column means data that doesn't arrive in the target system. It might not be caught until UAT, when users notice that a field they rely on is empty. By then, the mapping has to be added, the ETL job modified, data reloaded, and testing rerun.
- An incorrect transformation means data that arrives in the target system but is wrong. These are often the hardest issues to catch because the data looks populated — but the values are incorrect. They may not surface until after go-live, when real users encounter real problems.
- An ambiguous spec means the ETL developer made their best interpretation, which may not match the analyst's intent. The disconnect isn't discovered until testing, resulting in rework that could have been avoided with a clearer specification.
Multiply these scenarios across hundreds or thousands of column mappings, and you have a project where mapping quality is a major risk factor. Every mapping error that reaches testing or production costs 10 to 100 times more to fix than it would have cost to get right during the mapping phase.
Making mapping visual and structured doesn't just save time — it directly reduces project risk by catching errors before they compound into expensive downstream problems.
The Demo Reaction
The mapping interface is consistently the feature that gets the biggest reaction in dmPro demos. People who have spent years working with mapping spreadsheets see it and immediately understand the difference. It takes something that has always been tedious and error-prone and makes it visual, intuitive, and fast.
But more importantly, it makes it structured. And structure is what reduces risk. When mappings are visual, complete, and validated — and when job specs are generated rather than hand-written — the entire downstream workflow benefits. ETL development is faster. Testing finds fewer mapping-related issues. And the project stays on track.